BI Dashboard · Power BI 3-Page Report

Telecom Customer
Churn Analysis

End-to-end Power BI report analyzing churn drivers for a telecom company with 7,043 customers. Three interactive pages — KPI overview, behavioral deep dive, and financial impact assessment — built on a Star Schema with custom DAX measures.

Power BI Desktop DAX Star Schema Churn Analysis IBM Telco Dataset 7,043 customers
26.54%
Churn Rate
1 in 4 customers lost
$139K
Revenue at Risk
Monthly exposure
43%
M2M Churn Rate
vs 3% two-year contracts
3
Report Pages
KPI · Deep Dive · Financial
01 — Dashboard
3-Page Interactive Report
KPI Overview
Customer Deep Dive
Financial Impact
KPI Overview — Customer Churn Dashboard
KPI Overview
7K customers · 26.54% churn · $139K at risk
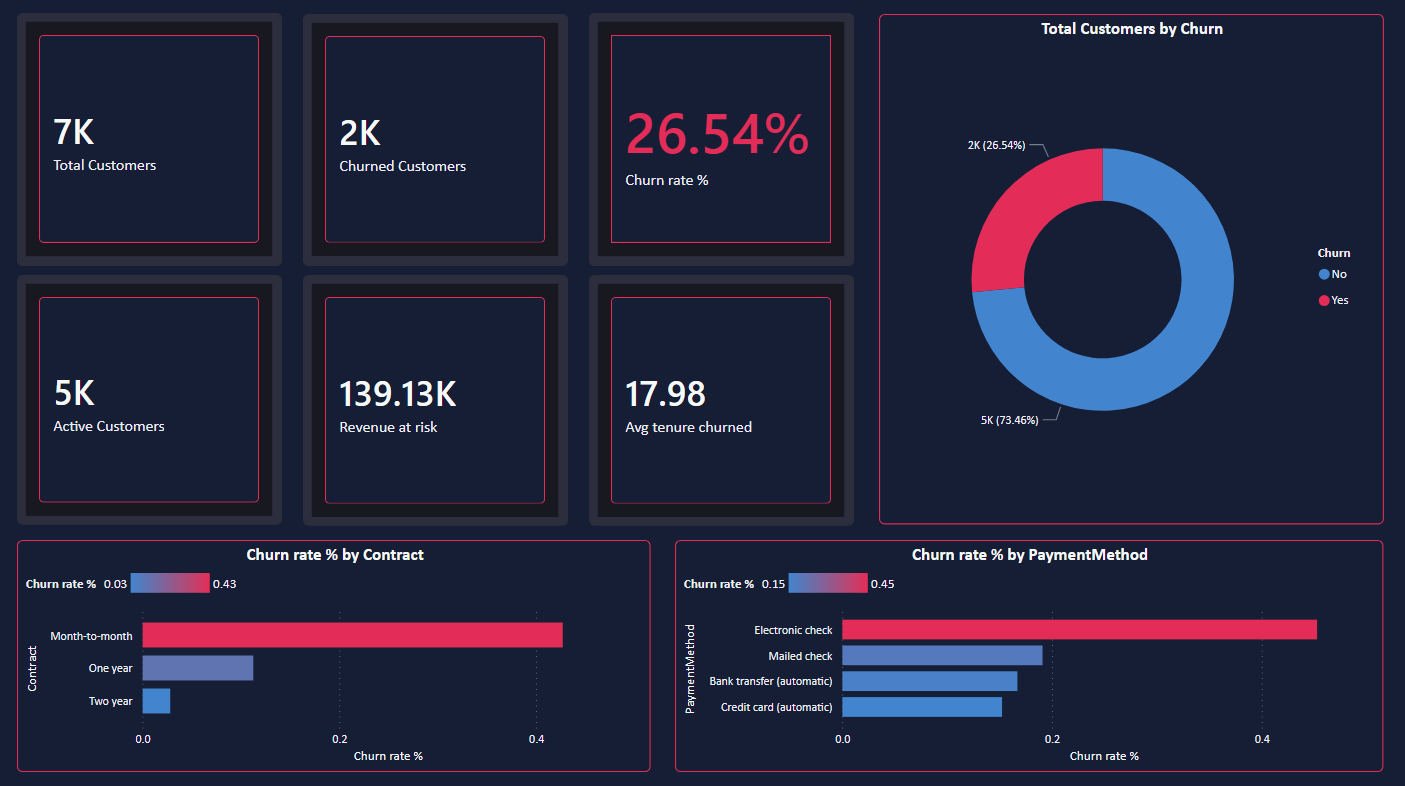
Page 1 · 6 KPI cards + donut chart + churn by contract/payment method
Customer Deep Dive
Customer Deep Dive
Scatter plot · Key Influencers visual · 6 churn drivers
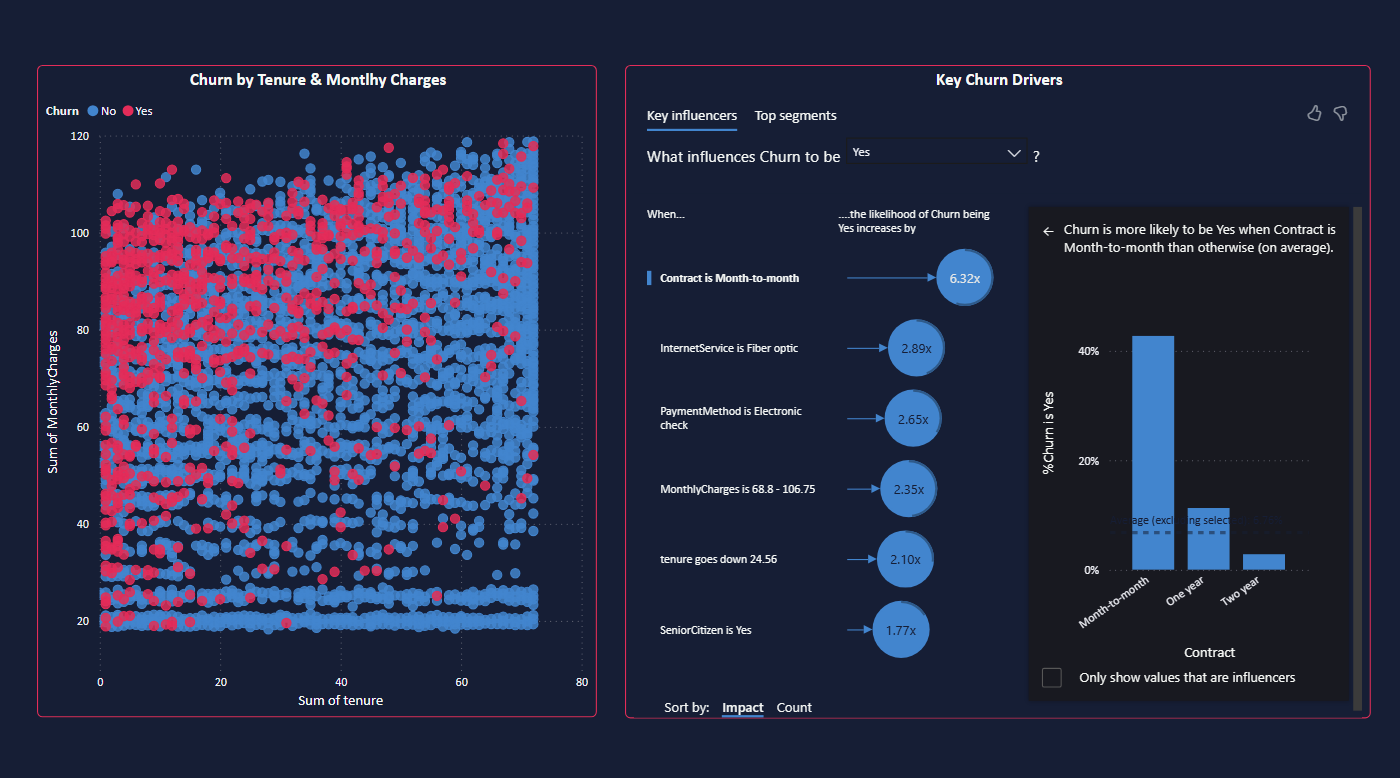
Page 2 · Churn by tenure & monthly charges · Key Influencers AI visual
Financial Impact
Financial Impact
$74 avg churned · $61 avg active · 89% M2M churn
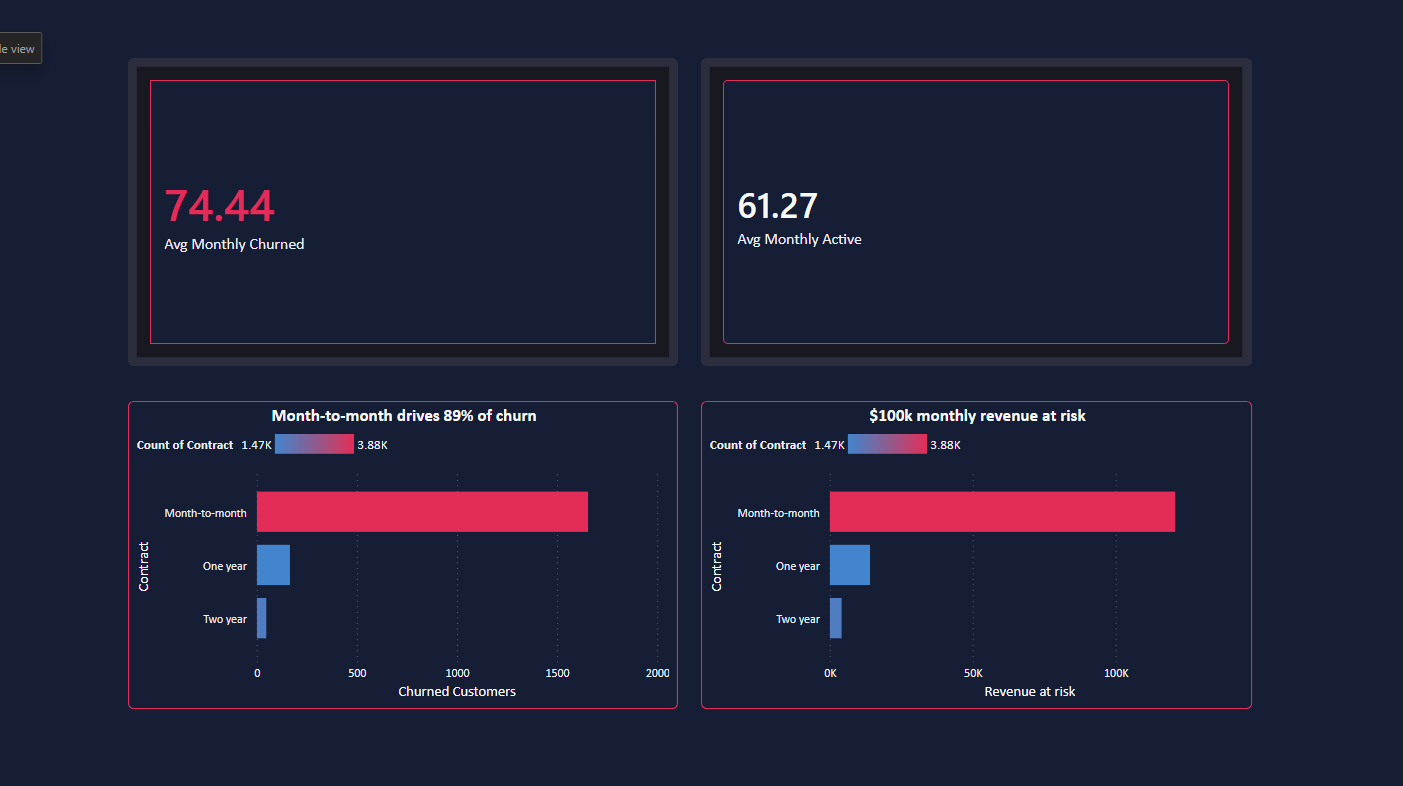
Page 3 · Avg monthly charges comparison · Revenue at risk by contract type
02 — Key Findings
What the Data Revealed
Finding 01
Contract type is the #1 churn lever
Month-to-month customers churn at 43% — over 10× higher than two-year contract customers at 3%. This single variable explains the majority of churn variance.
43% vs 3% churn rate
Finding 02
Price is NOT the problem
Churned customers were paying $74/month on average — 21% more than active customers at $61. High-paying customers are leaving, which points squarely to service quality, not price.
$74 churned vs $61 active
Finding 03
Churn concentrates in first 20 months
The scatter plot shows churn is heavily concentrated in customers with tenure under 20 months. Retention improves dramatically after that threshold — making early onboarding critical.
Avg tenure churned: 17.98 mo
Finding 04
Electronic check signals friction
Electronic check users show a 45% churn rate — the highest of all payment methods. This likely indicates lower service commitment and could be a proxy for dissatisfied customers.
45% churn — electronic check
Finding 05
Fiber optic adds risk
Fiber optic internet service increases churn likelihood by 2.89×. Despite being a premium product, it correlates with higher dissatisfaction — suggesting a quality or expectation gap.
2.89× churn multiplier
Finding 06
89% of churn from one segment
Month-to-month contracts account for 89% of all churned customers. Converting even a fraction of these to annual contracts represents the single highest-leverage retention action.
$100K+ monthly revenue at risk
03 — Behavioral Analysis
Top 6 Churn Drivers by Impact
Key Influencers — Power BI AI Visual
Likelihood multiplier
01 Contract is Month-to-month
6.32×
02 InternetService is Fiber optic
2.89×
03 PaymentMethod is Electronic check
2.65×
04 MonthlyCharges is $68.8 – $106.75
2.35×
05 Tenure below 24.56 months
2.10×
06 SeniorCitizen is Yes
1.77×
04 — Financial Impact
Revenue at Risk
Monthly Revenue at Risk
$139K
Direct monthly exposure from 2K churned customers at their average spend. This is the floor — full retention would recover up to $148K/month.
Note: Churned customers pay $74/mo avg vs $61 for active — retaining them at their actual spend recovers $148K, not $139K as the base KPI shows.
Month-to-Month Revenue Exposure
$100K+
Revenue at risk from the month-to-month segment alone. 89% of all churn originates here — converting these customers to annual contracts is the single highest-ROI retention action available.
Key insight: If we retain the M2M segment, we eliminate the majority of churn risk in a single strategic move.
05 — Strategic Recommendation
Three Retention Priorities

Since churned customers pay more than active ones, the problem is not price — it's service experience.

Convert M2M to Annual

Target month-to-month customers with incentives for annual conversion. This single action addresses 89% of churn volume and $100K+ monthly revenue risk.

Fix Fiber Optic Experience

Fiber optic users churn at 2.89× — despite paying a premium. Investigate service quality gaps and set clearer expectations at onboarding to reduce dissatisfaction.

Intensive First 20 Months

Churn is heavily concentrated before month 20. Implement a structured onboarding and check-in program for the first 20 months — the highest-risk window for loss.

06 — Tools & Methods
Built With
Power BI Desktop DAX Measures Star Schema Key Influencers AI Visual IBM Telco Dataset Slicers & Cross-filtering

From data to retention strategy

A 3-page interactive report that turns raw customer data into three actionable business priorities — each with a clear financial justification.

Back to Projects Python: Causal Inference